Central Northside/Allegheny City Central
Federal Street at North Avenue
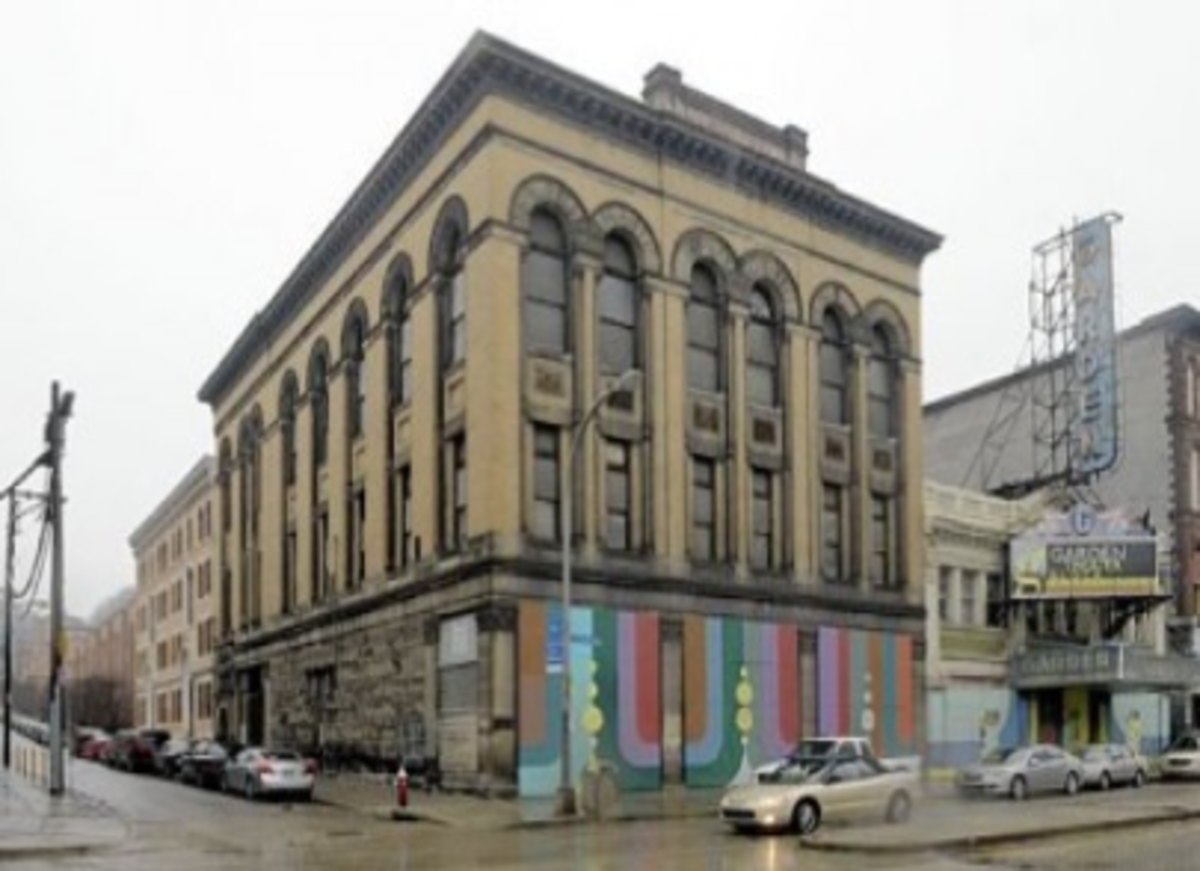
Featured Business
City of Asylum
Neighborhood Facts
- 8th densest neighborhood in Pittsburgh
- 5th highest street density (47 miles of streets per acre)
- 2nd highest level of residential investment ($1,178 of building permits per capita)
- Includes historic Mexican War Streets
- Persons per sq. mile: 11,614 (City average: 5,646)
- High number of cottage industries in area
- Walk Score: 79
- Number of bus lines: 12

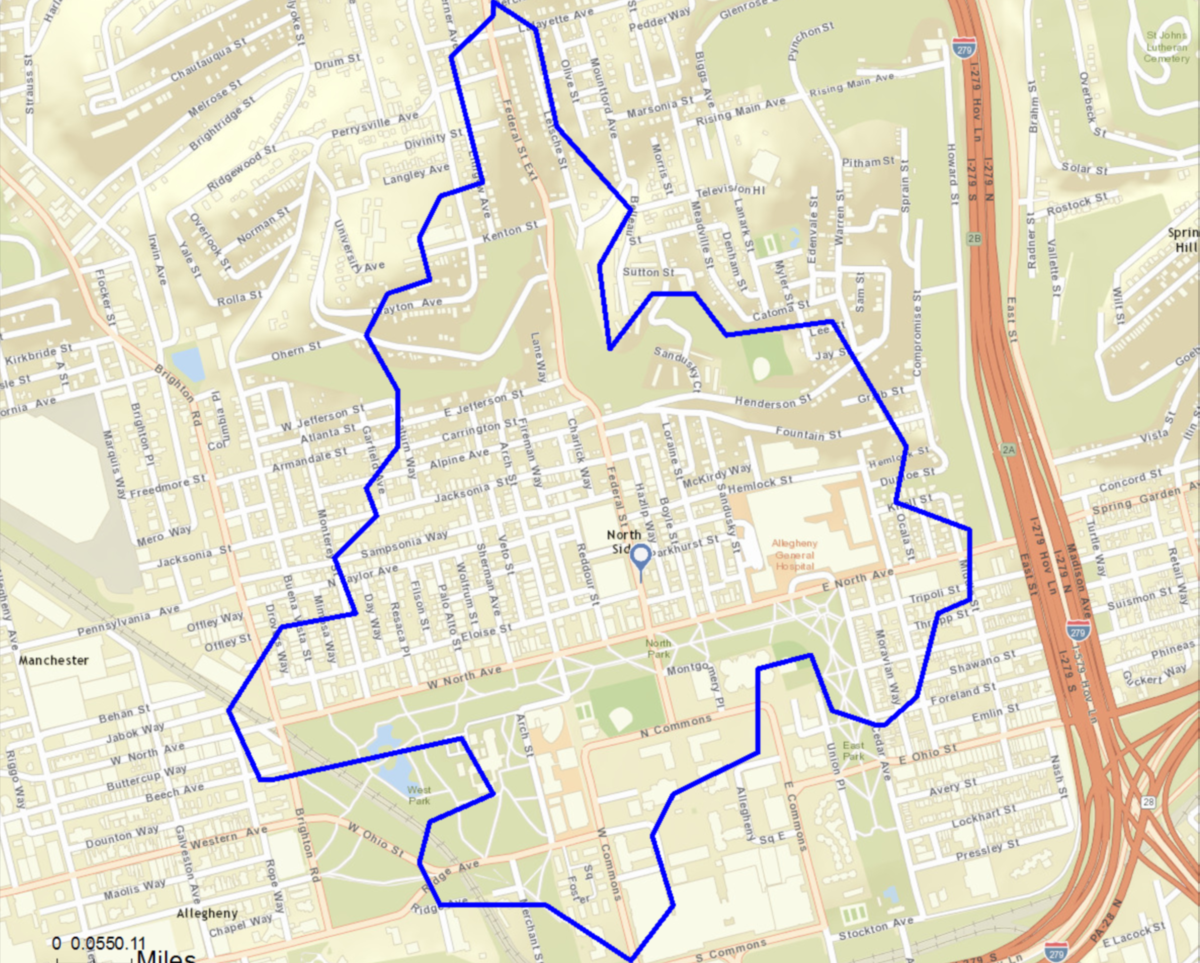
Central Northside/Allegheny City Central (Federal Street at North Avenue)
2-minute drive time radius
Major Commercial Industries
- Food & Beverage Stores
- Food Services & Drinking Places
- Apparel and Accessories
downloads
Marketplace Profile
| Marketplace Profile**: 2 Minute Drive Time | Retail Potential (Demand) | Retail Sales (Supply) | Retail Gap | Leakage/ Surplus Factor | Number of Business |
| Motor Vehicle & Parts Dealers | $7,155,138 | $0 | $7,155,138 | 100.0 | 0 |
| Furniture & Home Furnishing Stores | $1,222,116 | $0 | $1,222,116 | 100.0 | 0 |
| Electronics and Appliance Stores | $1,158,495 | $3,366,947 | $2,208,452 | -48.8 | 1 |
| Building Materials, Garden Equip. & Supply Stores | $1,928,345 | $437,734 | $1,490,611 | 63 | 1 |
| Food and Beverage Stores | $6,497,236 | $840,650 | $5,656,586 | 77.1 | 2 |
| Health and Personal Care Stores | $2,066,511 | $0 | $2,066,511 | 100.0 | 0 |
| Gasoline Stations | $3,447,838 | $0 | $3,447,838 | 100.0 | 0 |
| Clothing & Clothing Accessories Stores | $1,999,169 | $0 | $1,999,169 | 100.0 | 0 |
| Sporting Goods / Hobby / Music / Book Stores | $1,017,870 | $0 | $1,017,870 | 100.0 | 0 |
| General Merchandise Stores | $5,241,571 | $1,145,301 | $4,096,270 | 64.1 | 1 |
| Nonstore Retailers | $693,718 | $0 | $693,718 | 100.0 | 0 |
| Food Services & Drinking Places | $3,688,198 | $4,686,369 | -$998,171 | -11.9 | 15 |
**Supply (retail sales) estimates sales to consumers by establishments. Sales to businesses are excluded. Demand (retail potential) estimates the expected amount spent by consumers at retail establishments. The Leakage/Surplus Factor measures the relationship between supply and demand that ranges from +100 (total leakage) to -100 (total surplus). A positive value represents 'leakage' of retail opportunity outside the trade area. A negative value represents a surplus of retail sales, a market where customers are drawn in from outside the trade area. The Retail Gap represents the difference between Retail Potential and Retail Sales. The NAICS is used to classify businesses by their primary type of economic activity.
Demographic Data
| Demographic Data: 2 Minute Drive Time | 2010 | 2021 | 2026 (Projected) |
| Population | 2,336 | 2,204 | 2,207 |
| Households | 1,289 | 1,235 | 1,246 |
| Median Age | 39.8 | 42.1 | 42.9 |
| Median Age % 0-9 | 8.3% | 8.5% | 8.4% |
| Median Age: % 10-19 | 7.9% | 8.0% | 8.4% |
| Median Age: % 20-24 | 8.1% | 6.3% | 6.5% |
| Median Age: % 25-34 | 19.7% | 15.4% | 15.1% |
| Median Age: % 35-44 | 12.5% | 16.0% | 15.0% |
| Median Age: % 45-54 | 17.2% | 14.1% | 14.8% |
| Median Age: % 55-64 | 13.1% | 13.6% | 12.6% |
| Median Age: % 65+ | 13.2% | 18.0% | 19.4% |
| Median Household Income | *** | $55,782 | $61,889 |
| Average Household Income | *** | $90,687 | $103,961 |
| Per Capita Income | *** | $51,273 | $59,205 |
| Total Housing Units | 1,607 | 1,617 | 1,606 |
| Total Housing Units: % Owner Occupied Units | 25.8% | 22.4% | 23.3% |
| Total Housing Units: % Renter Occupied Units | 54.4% | 53.9% | 54.2% |
| Total Housing Units: % Vacant Housing Units | 19.8% | 23.6% | 22.4% |
| Median Home Value | *** | $325,000 | $362,044 |
Housing Data
- 22.4% Owner Occupied
- 53.9% Rental
- 23.6% Vacant