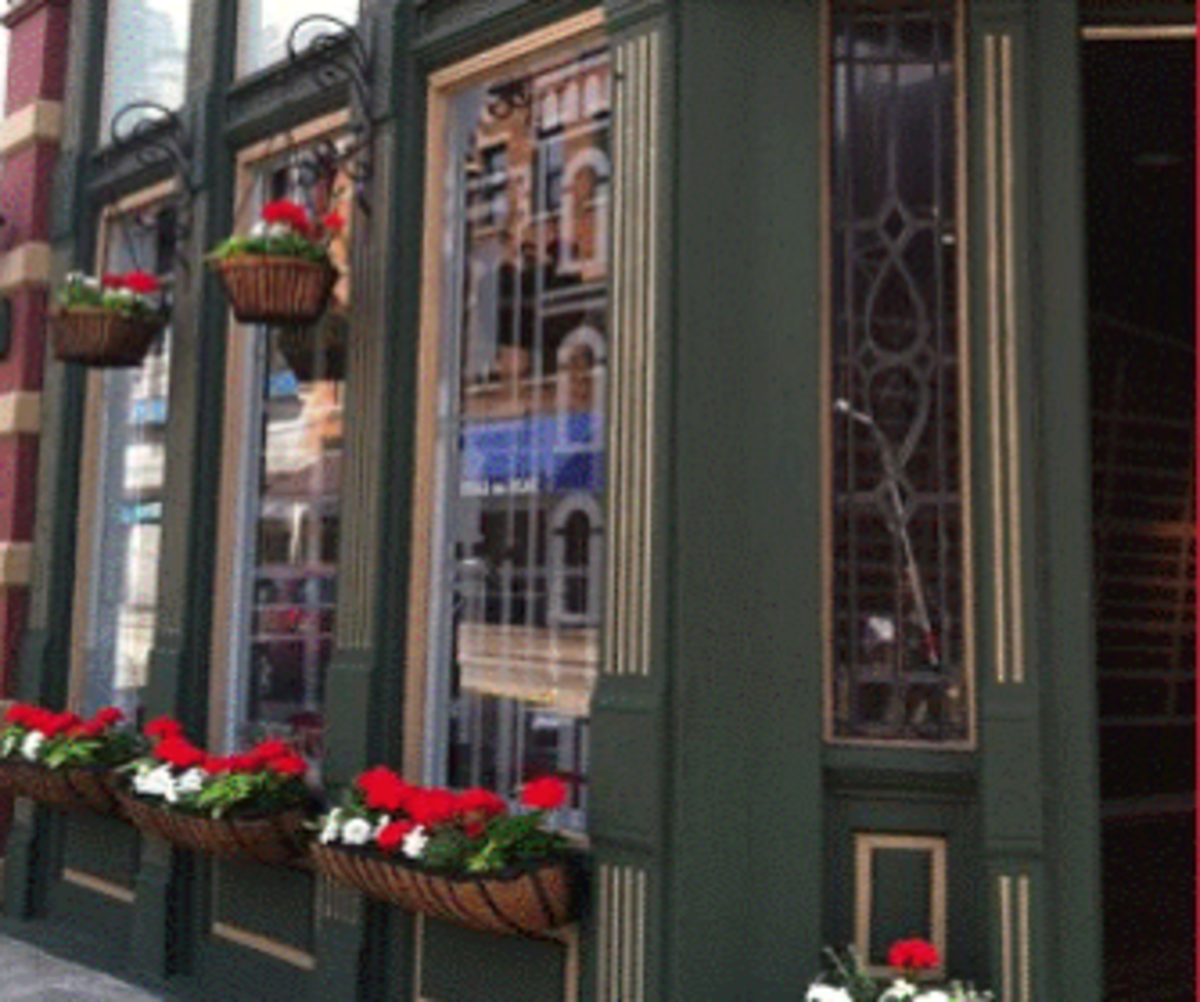
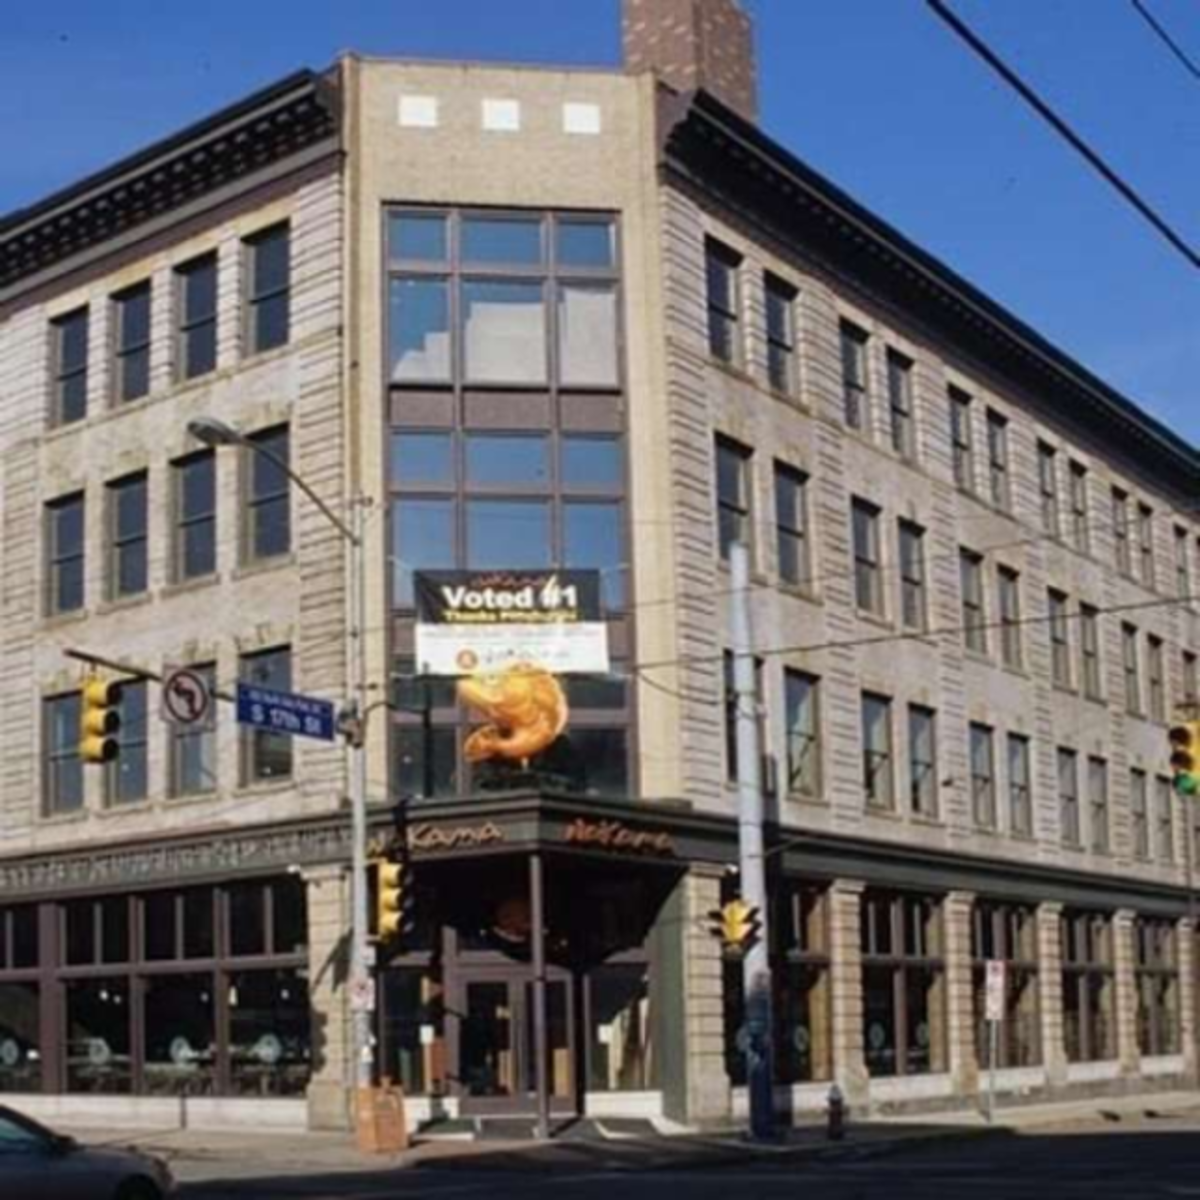
South Side
East Carson Street
Featured Business

Carmi's
Neighborhood Facts
- East Carson Street is a National Register Historic District
- 17th most populous neighborhood in Pittsburgh
- 2nd highest % of buildings build before 1939 in Pittsburgh
- Entertainment district creates a regional destination
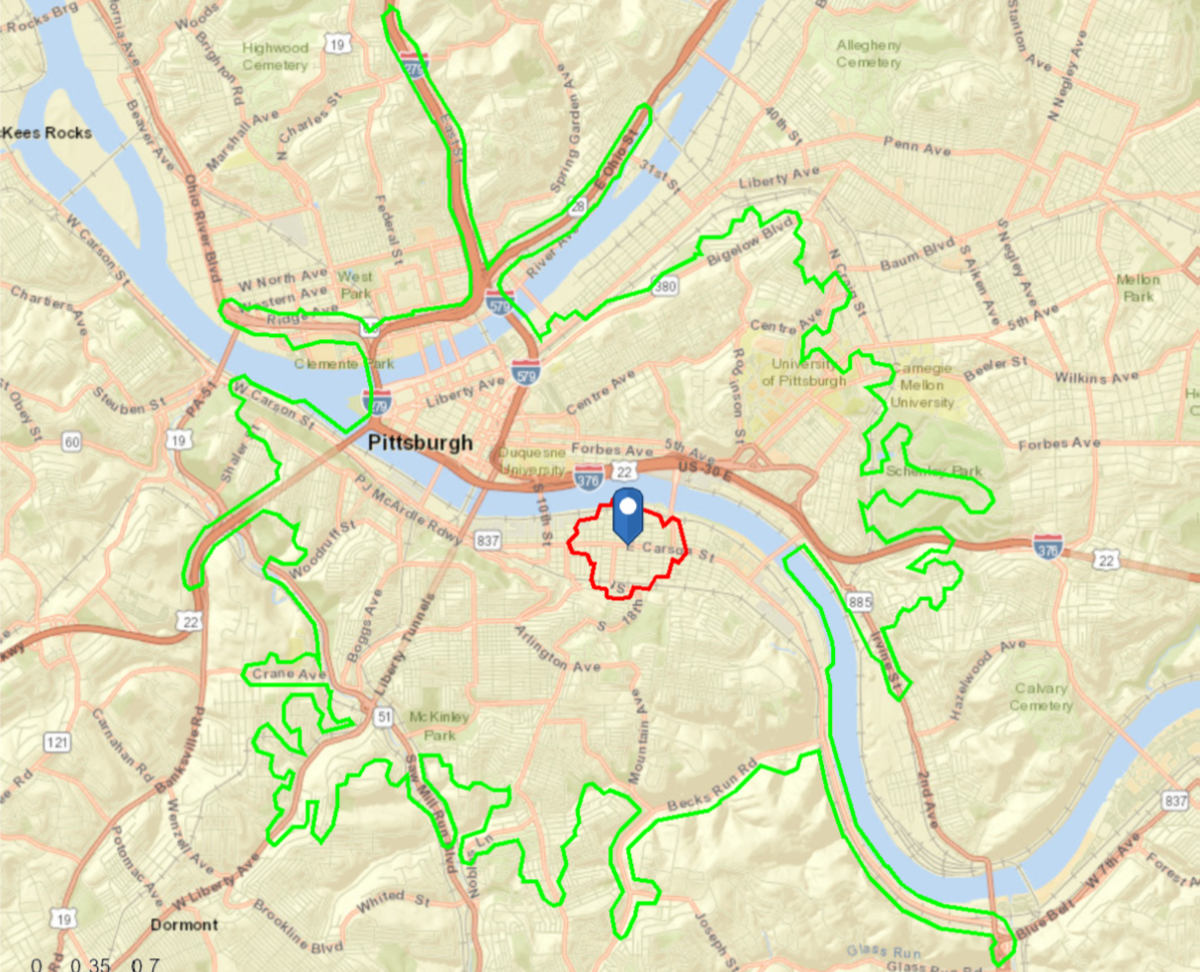
South Side (East Carson Street)
17th Street Partners, LP
2-minute drive time radius
Major Commercial Industries
- Food Services & Drinking Places
- Apparel and Accessories
- Furniture and Home Furnishings
downloads
Marketplace Profile
| Marketplace Profile**: 2 Minute Drive Time | Retail Potential (Demand) | Retail Sales (Supply) | Retail Gap | Leakage/ Surplus Factor | Number of Business |
| Motor Vehicle & Parts Dealers | $13,453,730 | $7,261,564 | $6,192,166 | 29.9 | 3 |
| Furniture & Home Furnishing Stores | $2,233,618 | $3,183,187 | -$949,569 | -17.5 | 2 |
| Electronics and Appliance Stores | $2,161,338 | $6,225,079 | -$4,063,741 | -48.5 | 3 |
| Building Materials, Garden Equip. & Supply Stores | $3,127,227 | $5,327,857 | -$2,200,630 | -26.0 | 2 |
| Food and Beverage Stores | $12,093,561 | $54,292,118 | -$42,198,557 | -63.6 | 7 |
| Health and Personal Care Stores | $3,642,144 | $10,307,765 | -$6,665,621 | -47.8 | 6 |
| Gasoline Stations | $6,533,607 | $9,718,646 | -$3,185,039 | -19.6 | 2 |
| Clothing & Clothing Accessories Stores | $3,783,387 | $32,606,839 | -$28,823,452 | -79.2 | 14 |
| Sporting Goods / Hobby / Music / Book Stores | $1,922,711 | $5,739,026 | -$3,816,315 | -49.8 | 5 |
| General Merchandise Stores | $9,767,180 | $1,629,983 | $8,137,197 | 71.4 | 2 |
| Nonstore Retailers | $1,252,553 | $6,989,722 | -$5,737,169 | -69.6 | 1 |
| Food Services & Drinking Places | $7,013,709 | $45,216,927 | -$38,203,218 | -73.1 | 62 |
**Supply (retail sales) estimates sales to consumers by establishments. Sales to businesses are excluded. Demand (retail potential) estimates the expected amount spent by consumers at retail establishments. The Leakage/Surplus Factor measures the relationship between supply and demand that ranges from +100 (total leakage) to -100 (total surplus). A positive value represents 'leakage' of retail opportunity outside the trade area. A negative value represents a surplus of retail sales, a market where customers are drawn in from outside the trade area. The Retail Gap represents the difference between Retail Potential and Retail Sales. The NAICS is used to classify businesses by their primary type of economic activity.
Demographic Data
| Demographic Data: 2 Minute Drive Time | 2010 | 2019 | 2024 (Projected) |
| Population | 3,657 | 3,777 | 3,896 |
| Households | 1,983 | 2,057 | 2,127 |
| Median Age | 29.2 | 29.7 | 30.7 |
| Median Age: % 0-9 | 3.1% | 2.8% | 2.8% |
| Median Age: % 10-14 | 1.0% | 1.0% | 0.9% |
| Median Age: % 15-24 | 28.7% | 26.4% | 25.2% |
| Median Age: % 25-34 | 29.6% | 30.7% | 29.9% |
| Median Age: % 35-44 | 9.4% | 8.7% | 9.1% |
| Median Age: % 45-54 | 8.1% | 6.9% | 6.6% |
| Median Age: % 55-64 | 8.5% | 9.4% | 9.0% |
| Median Age: % 65+ | 11.6% | 14.3% | 16.5% |
| Median Household Income | *** | $62,840 | $70,136 |
| Average Household Income | *** | $84,127 | $90,302 |
| Per Capita Income | *** | $46,987 | $50,618 |
| Total Housing Units | 2,340 | 2,303 | 2,357 |
| Total Housing Units: % Owner Occupied Units | 32.5% | 31.0% | 30.2% |
| Total Housing Units: % Renter Occupied Units | 52.2% | 58.3% | 60.1% |
| Total Housing Units: % Vacant Housing Units | 15.3% | 10.7% | 9.8% |
| Median Home Value | *** | $246,809 | $272,340 |
Housing Data
- 31.0% Owner Occupied
- 58.3% Rental
- 10.7% Vacant